Mining
Published Oct 1, 2026

Good mill lining design starts with better insight

Jenny Åkerström
Jenny Åkerström
Manager, Mill Lining Simulations
Dilek Alkac
Dilek Alkac
Principal Scientist, Wear Simulations
Every mill is different. Two mills may have similar dimensions, liners, and operating targets, yet perform very differently. Ore characteristics, charge levels, liner wear, and operating conditions all influence how a mill behaves, and those conditions change over time.
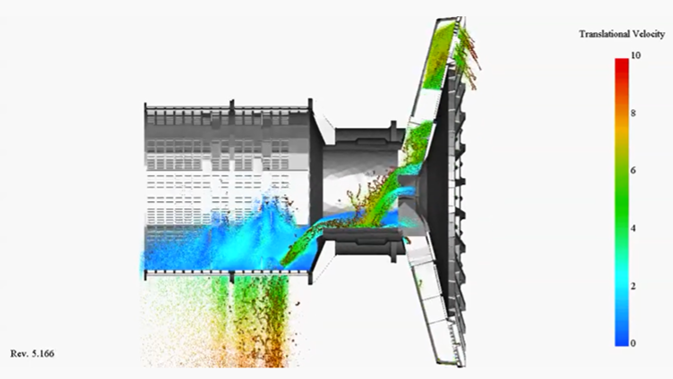
Mill Discharge Simulation

The challenge is that the most important processes inside the mill are difficult to observe directly. While we can measure power draw, throughput and wear rates, those numbers do not show how the charge moves, how wear changes, or how material flows through the discharge system. This is where simulation becomes valuable. 

Simulation allows us to evaluate design options and understand their impact on wear performance, grinding efficiency, and overall process performance before changes are made in the plant. By testing different scenarios in advance, customers can reduce uncertainty, lower operational risk and make decisions that support long-term grinding circuit performance. 

Simulation strengthens optimization

Simulation is an important part of how Metso approaches mill lining optimization. Good liner design starts with understanding wear behavior and how it influences, and is influenced by, operating conditions and flow performance. Using Discrete Element Method (DEM) and Smoothed-Particle Hydrodynamics (SPH), charge motion, impact behavior, energy distribution, and material flow under real operating conditions can all be analyzed. 

Simulation helps answer practical questions such as: 

  • How can shell liners be designed to achieve balanced wear and maintain grinding efficiency throughout liner life?
  • How can liner designs be optimized to accommodate changes in operating conditions?
  • How will a different liner profile affect charge motion and relative power draw?
  • Is the discharge system handling the current flow efficiently? 
Instead of relying on assumptions, different options can be compared and decisions can be made based on how they are expected to perform in practice. This helps identify opportunities to improve throughput, maintain stable production, optimize energy use, and support the overall efficiency of the grinding circuit.
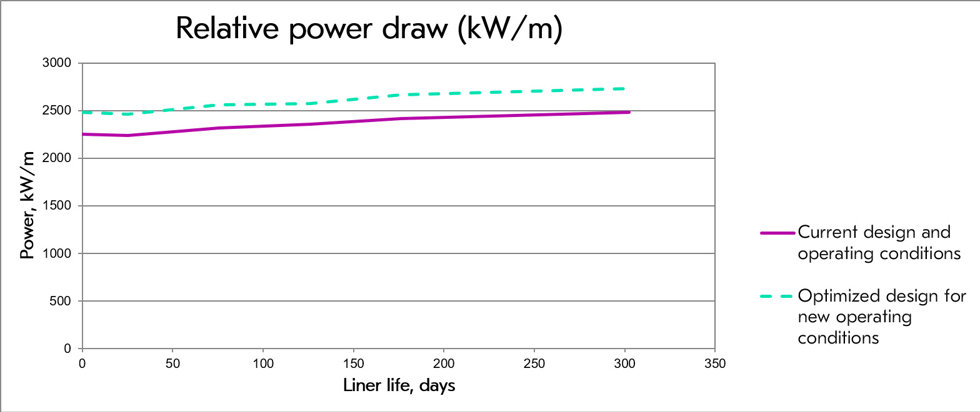
Mill lining simulation - relative power draw graph
New operating conditions increase relative power draw, leading to higher wear rates. Optimized liner design can help compensate for the increased wear demand.
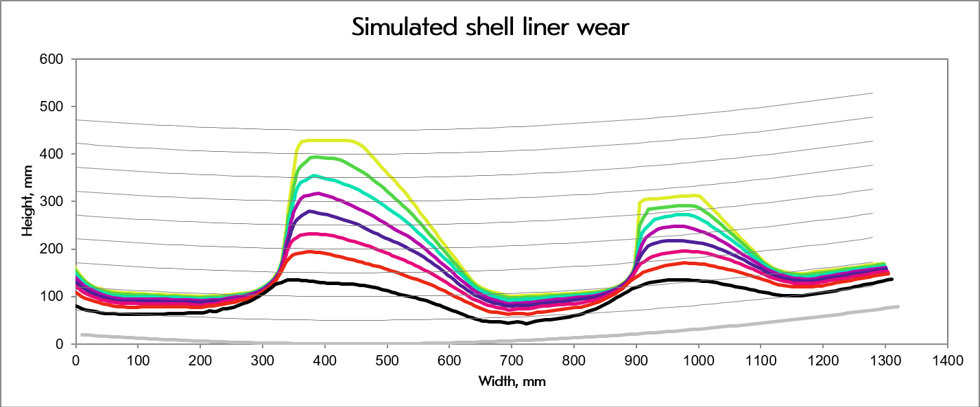
Simulated shell liner wear graph
The simulation shows how the shell liner wears over time. The yellow line indicates the original profile.

Improving discharge performance

Shell liner design is important, but the discharge end of the mill also has a major impact on performance. If material cannot leave the mill efficiently, throughput, energy consumption, and wear can all be affected. 

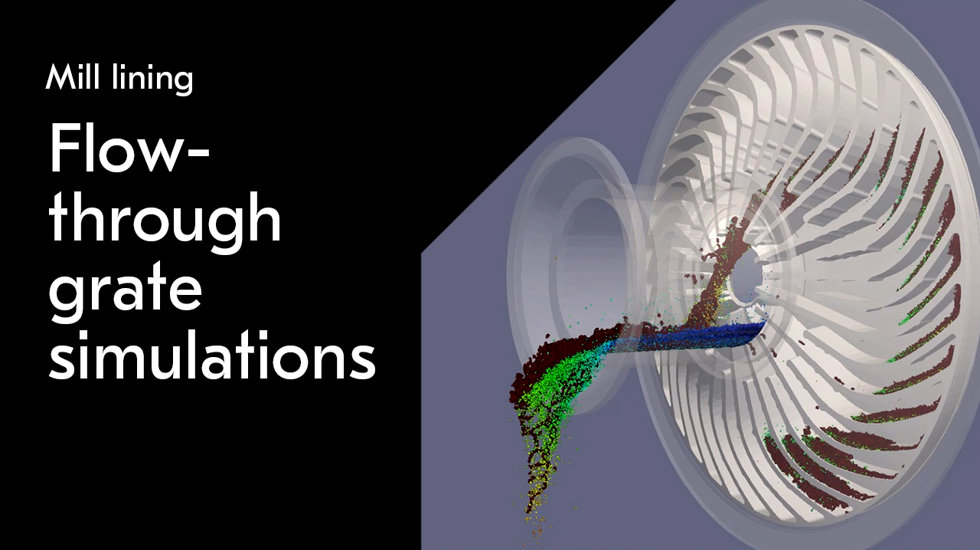
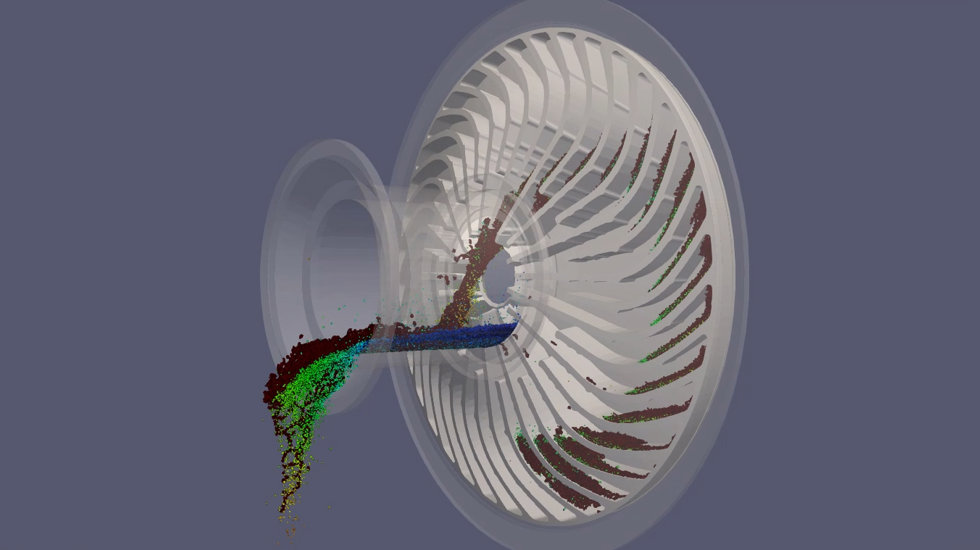
Metso's Flow Through Grates (FTG) simulation combines DEM and SPH technology to evaluate how solids and slurry move through grate openings and pulp lifters under realistic operating conditions. 

With FTG simulation, the following can be assessed: 

  • Discharge rates and net flow through grate openings
  • Solids concentration in the discharge
  • Flow behavior, including flowback and carry-over
  • Size distribution of discharged material 
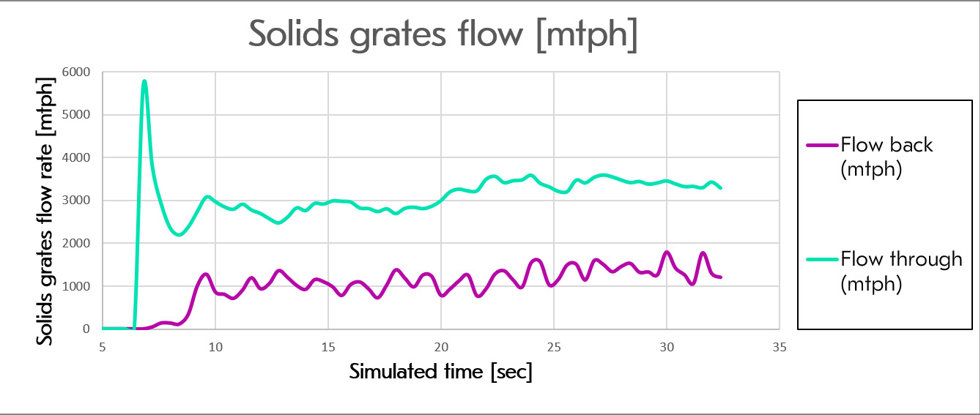
Solids grates flow graph
Net discharge flow is created by maximizing flow through the grates and minimizing flow back into the mill. The FTG tool helps identify grate and pulp lifter designs that improve discharge efficiency.

Turning insight into action 

The purpose of simulation is not simply to create visualizations; it is to support decisions that improve plant performance. It is not always possible to extend liner life and grinding efficiency at the same time. A design that extends wear life may reduce impact intensity or occupy more volume in the mill, while a leaner, more aggressive profile may improve grinding performance but shorten service life. 

By modeling different scenarios before changes are made, simulation helps identify the right balance between competing objectives and reduces the risk associated with design decisions. It also helps customers evaluate how liner and discharge designs affect throughput, energy consumption, wear life, maintenance intervals, equipment availability, and total cost of ownership. 

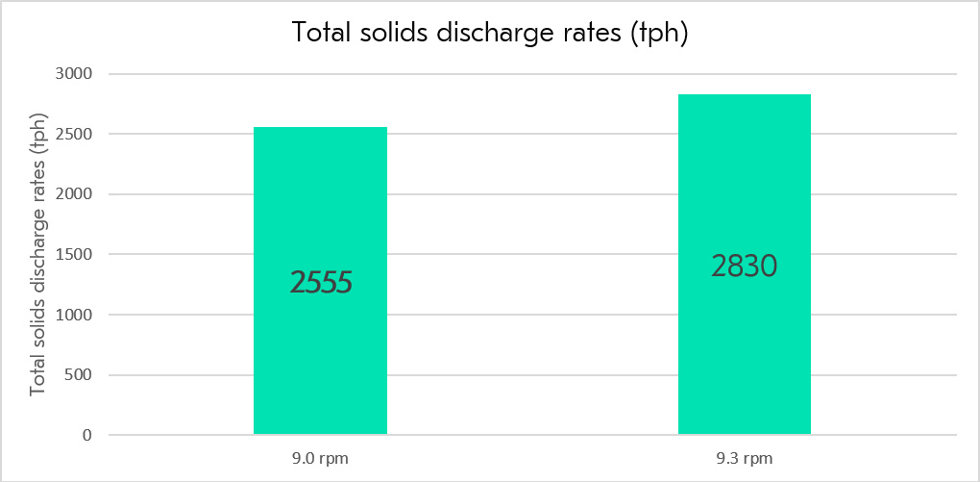
Total solids discharge rates graph
FTG simulations show the relative change in throughput achieved at different mill speeds.

Good decisions start with better understanding 

Ultimately, mill lining optimization is about making better decisions and achieving operating targets that often change gradually over time. As a mill is a closed vessel, it is not possible to observe what is happening inside. Without visibility, decisions rely heavily on assumptions based on process metrics and past experience. While those remain valuable, they can leave important questions unanswered and introduce uncertainty. Simulation adds a deeper level of understanding by enabling us to look inside the mill, identify limitations, test ideas and evaluate potential outcomes before changes are implemented. 

Metso has developed and refined its simulation capabilities over decades, combining process expertise, equipment design knowledge, and field experience to develop solutions tailored to each application.  

This helps us understand and demonstrate to our customers, not only how individual liner designs perform, but how those decisions affect the grinding circuit as a whole. The result is a more informed path toward improved availability, efficiency, and long-term performance. Because every mill is different and understanding those differences is what ultimately drives better performance. 

Mining
Your information is safe. Check our privacy notice for more details.
Thank you!
We will shortly contact you. You can send a new inquiry again after 15 minutes.